The Paycheck Protection Program (PPP) is in the news again, as the list of the small businesses who received loans and for how much, is officially in hands of the public. Nearly 5 million small businesses took more than $650 billion in loans as of the end of June, used a lifeline to keep things going during the slowdown. The problem though is some of the loans made were quite questionable at best, upsetting many on Main Street why those who didn’t need a loan got it.
“The intent of PPP was to help a steadier employment picture during the COVID-19 shutdown, but yes, some businesses have tapped into the program who shouldn’t have,” explained LPL Financial Chief Investment Officer Burt White. “PPP has been far from perfect, but to focus on the few who shouldn’t have gotten a loan overshadows the enormous benefit received by so many that needed it.”
For more of Burt’s take on the PPP and why it has been a success, please watch our latest LPL Street View video below.
IMPORTANT DISCLOSURES
This material is for general information only and is not intended to provide specific advice or recommendations for any individual. There is no assurance that the views or strategies discussed are suitable for all investors or will yield positive outcomes. Investing involves risks including possible loss of principal. Any economic forecasts set forth may not develop as predicted and are subject to change.
References to markets, asset classes, and sectors are generally regarding the corresponding market index. Indexes are unmanaged statistical composites and cannot be invested into directly. Index performance is not indicative of the performance of any investment and do not reflect fees, expenses, or sales charges. All performance referenced is historical and is no guarantee of future results.
Any company names noted herein are for educational purposes only and not an indication of trading intent or a solicitation of their products or services. LPL Financial doesn’t provide research on individual equities. All information is believed to be from reliable sources; however, LPL Financial makes no representation as to its completeness or accuracy.
This Research material was prepared by LPL Financial, LLC.
Securities and advisory services offered through LPL Financial (LPL), a registered investment advisor and broker-dealer (member FINRA/SIPC).
Insurance products are offered through LPL or its licensed affiliates. To the extent you are receiving investment advice from a separately registered independent investment advisor that is not an LPL affiliate, please note LPL makes no representation with respect to such entity.
Not Insured by FDIC/NCUA or Any Other Government Agency
The wild ride of 2020 continues, with the S&P 500 Index down 20% in the first quarter and up 20% in the second quarter. Much like dropping a 20 dollar bill and picking it up, this doesn’t mean you are 20 dollars wealthier. Down 20% and then up 20% actually comes out to a 4% drop for the first half of the year.
What does a negative first half of the year tell us? Turns out, gains could be hard to come by the second half of this year. “Although 2020 is like nothing we’ve seen before, the fact of the matter is a weak first half of the year could mean weaker than normal returns for the rest of the year,” according to LPL Financial Senior Market Strategist Ryan Detrick.
In fact, the S&P 500 had been higher in the first six months of the year a record nine consecutive years before being lower in 2020. Since 1950, there were 48 times when the first six months were higher and the rest of the year gained 77% of the time and added 5.8% on average those final six months. Compare that with when the first six months of the year were lower 21 times, the final six months were higher only 52% of the time and up only 1.2% on average.
As shown in the LPL Chart of the Day, a move higher is quite likely after strength in the first six months of the year, while very modest gains could be in the cards if those first six months underwhelm.
Be on the lookout for our Midyear Outlook 2020, set to be released on July 14, for more of our thoughts on what the second half of 2020 could bring. Last, don’t forget to listen to our latest LPL Market Signals podcast, where we discuss trends impacting markets right now.
IMPORTANT DISCLOSURES
This material is for general information only and is not intended to provide specific advice or recommendations for any individual. There is no assurance that the views or strategies discussed are suitable for all investors or will yield positive outcomes. Investing involves risks including possible loss of principal. Any economic forecasts set forth may not develop as predicted and are subject to change.
References to markets, asset classes, and sectors are generally regarding the corresponding market index. Indexes are unmanaged statistical composites and cannot be invested into directly. Index performance is not indicative of the performance of any investment and do not reflect fees, expenses, or sales charges. All performance referenced is historical and is no guarantee of future results.
Any company names noted herein are for educational purposes only and not an indication of trading intent or a solicitation of their products or services. LPL Financial doesn’t provide research on individual equities. All information is believed to be from reliable sources; however, LPL Financial makes no representation as to its completeness or accuracy.
This Research material was prepared by LPL Financial, LLC.
Securities and advisory services offered through LPL Financial (LPL), a registered investment advisor and broker-dealer (member FINRA/SIPC).
Insurance products are offered through LPL or its licensed affiliates. To the extent you are receiving investment advice from a separately registered independent investment advisor that is not an LPL affiliate, please note LPL makes no representation with respect to such entity.
Not Insured by FDIC/NCUA or Any Other Government Agency
Not Bank/Credit Union Guaranteed
Not Bank/Credit Union Deposits or Obligations
May Lose Value
Market Update: Wed, Jul 8, 2020 | LPL Financial Research
The win streak is over. US stocks opened modestly higher after the S&P 500 Index’s five-day win streak was snapped Tuesday. It is a very quiet day, with the usual concerns over COVID-19 cases and potential impact, along with discussions on challenges to the widely expected stimulus bill. Overnight, China continued recent outperformance, while Europe is down slightly.
Coming July 14. LPL Research’s Midyear Outlook 2020: The Trail to Recovery reviews where we’ve been in 2020, where we may be heading, and the path that will take us there. Our special elections section explains how stocks and the economy may predict the next president. Look for the interactive digital version, a streamlined printer-friendly version, and supporting marketing collateral July 14.
A quick look back. It’s been a wild ride for stocks in 2020. So far the year has delivered the worst pandemic to hit the United States in over 100 years, a government-induced lockdown recession, stomach-churning market volatility, and massive stimulus from policymakers totaling several trillion dollars. We look at the stock market’s performance in the first half of 2020 and highlight the leaders of the sharp rebound off late-March lows later today in the LPL Research blog.
COVID-19 news. In the United States, a record of 60,000 new cases were confirmed on Tuesday, up 31% week over week (source: Johns Hopkins). New cases in Texas topped 10,000 for the first time. Holiday catch-up played a role in case growth and testing, with a record 846,000 tests Tuesday. Discouragingly, the death rates in Arizona, Florida, and Texas all reached new highs. In Brazil, second only to the United States in cases globally, President Jair Bolsonaro tested positive for the virus. The World Health Organization acknowledged evidence is emerging of airborne spread of COVID-19 (source: The COVID Tracking Project).
IMPORTANT DISCLOSURES
This material is for general information only and is not intended to provide specific advice or recommendations for any individual. There is no assurance that the views or strategies discussed are suitable for all investors or will yield positive outcomes. Investing involves risks including possible loss of principal. Any economic forecasts set forth may not develop as predicted and are subject to change.
References to markets, asset classes, and sectors are generally regarding the corresponding market index. Indexes are unmanaged statistical composites and cannot be invested into directly. Index performance is not indicative of the performance of any investment and do not reflect fees, expenses, or sales charges. All performance referenced is historical and is no guarantee of future results.
Any company names noted herein are for educational purposes only and not an indication of trading intent or a solicitation of their products or services. LPL Financial doesn’t provide research on individual equities.
All information is believed to be from reliable sources; however, LPL Financial makes no representation as to its completeness or accuracy.
All index and market data are from FactSet and MarketWatch.
This Research material was prepared by LPL Financial, LLC.
Securities and advisory services offered through LPL Financial (LPL), a registered investment advisor and broker-dealer (member FINRA/SIPC).
Insurance products are offered through LPL or its licensed affiliates. To the extent you are receiving investment advice from a separately registered independent investment advisor that is not an LPL affiliate, please note LPL makes no representation with respect to such entity.
Not Insured by FDIC/NCUA or Any Other Government Agency
It’s certainly been a wild ride for stocks in 2020. Barely past the halfway point, the year has already brought the worst pandemic to hit the US in over 100 years, an unprecedented government-induced recession as much of the country was locked down, some stomach-churning market volatility, and massive, unprecedented stimulus from policymakers totaling several trillion dollars—that’s trillion with a “t”.
The dizzying volatility began in late February with the fastest-ever bear market decline (going back to the inception of the Dow Industrials in 1896). It took just 19 trading days for the Dow to close more than 20% below its record high (February 19 through March 12). The S&P 500 Index fell 20% during the first quarter, one of the worst starts to a year ever.
After the March 23 low in the S&P 500, the record breaking continued as the S&P 500 staged its best 50-day rally since the inception of the S&P 500 more than 60 years ago. The strong snapback led to a 20% second quarter gain, the best for the index since the fourth quarter of 1998, and brought the S&P 500 to within 3% of a positive year as of June 30 based on total return.
Growth stocks led the way, as shown in the LPL Chart of the Day, continuing their decade-long run of nearly uninterrupted dominance over value stocks as the Russell 1000 Growth Index trounced its Value counterpart during the quarter.
“The dominance of growth stocks is one of the biggest stories for the market in 2020,” noted LPL Financial Equity Strategist Jeffrey Buchbinder. “Stronger balance sheets, better earnings, and favorable positioning for the work-from-home trend suggest this historic run for growth stocks over the past decade may still have legs.”
The US continued its multi-year trend of outperforming non-US equity markets based on the MSCI EAFE and Emerging Market Indexes. And consistent with historical patterns coming off major market lows, smaller cap stocks outperformed their larger cap counterparts during the quarter.
Sector leadership looked similar to that of the last bull market from March 2009 through February 2020, with consumer discretionary and technology on top. These growth sectors are well positioned for the current environment, in our view, given the work-from-home trend and large allocation to internet retail within the consumer discretionary sector.
For more of our thoughts on the year, please listen to our latest LPL Market Signals podcast here.
Look for our Midyear Outlook 2020—an outlook for the economy, stocks, bonds, and the election—on July 14.
IMPORTANT DISCLOSURES
This material is for general information only and is not intended to provide specific advice or recommendations for any individual. There is no assurance that the views or strategies discussed are suitable for all investors or will yield positive outcomes. Investing involves risks including possible loss of principal. Any economic forecasts set forth may not develop as predicted and are subject to change.
References to markets, asset classes, and sectors are generally regarding the corresponding market index. Indexes are unmanaged statistical composites and cannot be invested into directly. Index performance is not indicative of the performance of any investment and do not reflect fees, expenses, or sales charges. All performance referenced is historical and is no guarantee of future results.
This Research material was prepared by LPL Financial, LLC.
Securities and advisory services offered through LPL Financial (LPL), a registered investment advisor and broker-dealer (member FINRA/SIPC).
Insurance products are offered through LPL or its licensed affiliates. To the extent you are receiving investment advice from a separately registered independent investment advisor that is not an LPL affiliate, please note LPL makes no representation with respect to such entity.
Not Insured by FDIC/NCUA or Any Other Government Agency
2020 is an election year, and history shows that the US economy has had major bearings on presidential election. How stocks and the economy are performing prior to the election may forecast the winner.
The Makeup of Congress is very important
Although all election years feel different, 2020 no doubt may be one of the most unique election years ever. We have a pandemic, a deep recession, extremely heightened partisanship, a mail-in ballot controversy, an unpredictable president, and the oldest presidential candidate ever.
Amazingly, 1940 was the last time the S&P 500 Index was lower during an election year with an incumbent in the White House. Historically, when a president has been up for reelection, it has tended to boost stocks. Stocks were down big in 2008—but President George W. Bush had finished his two terms. It isn’t about Republican or Democrat—it’s about incumbents trying to boost the economy and stock prices by the time voters go to the polls. Some good news on the economy in the coming months or progress toward a vaccine could potentially get the S&P 500 back to positive territory for the year, after being down 30% year to date in March, and it’s possible that may help President Donald Trump’s reelection chances.
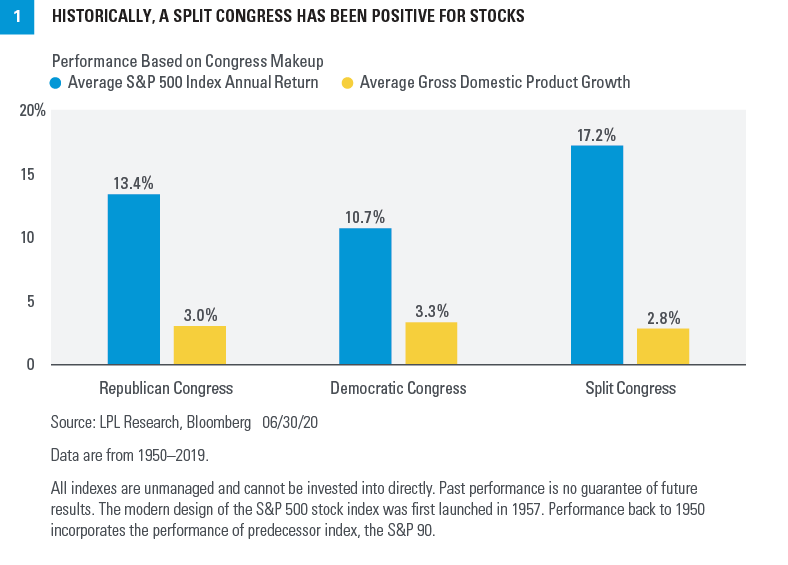
We’re often asked if stocks perform better under a Republican or Democratic president. We’d take a different view and point out that stocks have tended to do their best when we have a split Congress [Figure 1]. Markets tend to like checks and balances to make sure one party doesn’t have too much sway.
When Republicans have controlled both chambers in Washington, DC, on average the S&P 500 has gained 13.4% per year and gross domestic product (GDP) has grown 3%. When Democrats have controlled both the House of Representatives and the Senate, the economy did a little better, with GDP growth of 3.3%, while the S&P 500 was up 10.7% on average. Some of the best stock gains in recent memory took place under a split Congress. Stocks gained close to 30% in 1985, 2013, and 2019, all under a split Congress. The average S&P 500 gain with a divided Congress was 17.2% while GDP growth averaged 2.8%, again suggesting markets may prefer split power come November.
Watch the Economy
History shows that the US economy has had major bearings on the presidential election outcomes. If there has been a recession during the year or two before the election, the incumbent president has tended to lose. If there were no recession during that time, the incumbent tended to win. Incredibly, the economy has predicted the winning president every year going back to President Calvin Coolidge, when he won despite a recession within two years of the election. But Coolidge inherited a recession when President Warren G. Harding passed away, and by the time people voted in November 1924, the Roaring ‘20s had started to take hold, and the economy was strong again.
Our analysis suggests the 2020 presidential race is still up in the air. If the economy continues to open up, a vaccine is on the way, and the massive stimulus continues to drive asset prices higher, President Trump’s chances may improve. A weak economy struggling to come out of recession and weaker markets would likely favor challenger former Vice President Joe Biden.
And watch the Stock Market
Since 1928, the stock market has accurately predicted the winner of the presidential election 87% of the time, including every single election since 1984. It’s quite simple. When the S&P 500 has been higher the three months before the election, the incumbent party usually has won; when stocks were lower, the incumbent party usually has lost.
Think back to 2016, when virtually no one expected Hillary Clinton to lose—except for the stock market. Stocks were quite weak leading up to the election, with the Dow Jones Industrial Average down nine days in a row. Copper (a President Trump play on infrastructure) was in the green a record 14 consecutive days.
Potential policy changes
Markets tend to be volatile ahead of elections because of the uncertainty around possible policy changes. In this election, the stakes are particularly high for corporate America because a takeover of the Senate by Democrats and a possible Biden victory reportedly may lead to an increase in the corporate tax rate from 21% to 28% and unwind the corporate earnings boost the 2017 Tax Cut and Jobs Act delivered.
Other areas to watch that could impact markets:
Tighter financial regulation could have some market impact.
Healthcare should perform well regardless of the election outcome with “Medicare for All” off the table.
Energy could be hurt by a potential blue wave, but prices may get support from lower production and higher production costs.
As we get closer to the November election, how stocks and the economy are doing could be a big signal for who will win the election and be in office in January.
This material is for general information only and is not intended to provide specific advice or recommendations for any individual. There is no assurance that the views or strategies discussed are suitable for all investors or will yield positive outcomes. Investing involves risks including possible loss of principal. Any economic forecasts set forth may not develop as predicted and are subject to change.
References to markets, asset classes, and sectors are generally regarding the corresponding market index. Indexes are unmanaged statistical composites and cannot be invested into directly. Index performance is not indicative of the performance of any investment and do not reflect fees, expenses, or sales charges. All performance referenced is historical and is no guarantee of future results.
Any company names noted herein are for educational purposes only and not an indication of trading intent or a solicitation of their products or services. LPL Financial doesn’t provide research on individual equities.
All information is believed to be from reliable sources; however, LPL Financial makes no representation as to its completeness or accuracy.
The Standard & Poor’s 500 Index (S&P500) is a capitalization-weighted index of 500 stocks designed to measure performance of the broad domestic economy through changes in the aggregate market value of 500 stocks representing all major industries.
This research material has been prepared by LPL Financial LLC.
Securities and advisory services offered through LPL Financial (LPL), a registered investment advisor and broker-dealer (member FINRA/SIPC). Insurance products are offered through LPL or its licensed affiliates. To the extent you are receiving investment advice from a separately registered independent investment advisor that is not an LPL affiliate, please note LPL makes no representation with respect to such entity.
Not Insured by FDIC/NCUA or Any Other Government Agency | Not Bank/Credit Union Guaranteed | Not Bank/Credit Union Deposits or Obligations | May Lose Value
Following the massive beat in May nonfarm payrolls, many wondered if last month’s job gains pulled forward hiring ahead of the expiration of the Paycheck Protection Program to ensure small business loans were forgivable. Recall that the US labor market added 2.5 million jobs in May (revised up to 2.7 million in the June report) versus Bloomberg consensus expectations for a loss of 7.5 million jobs.
The June report helped put those concerns to rest, as the US economy added 4.8 million jobs, surpassing Bloomberg’s median consensus estimate of 3.2 million. As shown in the LPL Chart of the Day, nonfarm payrolls have been on a wild ride in 2020:
However, despite surpassing expectations in the headline numbers, the June report also revealed that permanent job losses continue to tick higher. “Job growth remains the key to the economic recovery,” added LPL Chief Investment Officer Burt White. “The pandemic has been a major shock to the labor market that will take time to heal, but the solid job gains over the past two months suggest the recovery is well on its way and the recession may already be over.”
The unemployment rate dropped more than two points to 11.1% versus consensus of 12.5%, while misclassifications around the “absent from work but employed” issue would add only one point (compared with three points last month). Although the June report was a much smaller upside surprise than last month’s shocker, the job market is clearly coming back stronger than most economists expected.
IMPORTANT DISCLOSURES
This material is for general information only and is not intended to provide specific advice or recommendations for any individual. There is no assurance that the views or strategies discussed are suitable for all investors or will yield positive outcomes. Investing involves risks including possible loss of principal. Any economic forecasts set forth may not develop as predicted and are subject to change.
References to markets, asset classes, and sectors are generally regarding the corresponding market index. Indexes are unmanaged statistical composites and cannot be invested into directly. Index performance is not indicative of the performance of any investment and do not reflect fees, expenses, or sales charges. All performance referenced is historical and is no guarantee of future results.
Any company names noted herein are for educational purposes only and not an indication of trading intent or a solicitation of their products or services. LPL Financial doesn’t provide research on individual equities.
All information is believed to be from reliable sources; however, LPL Financial makes no representation as to its completeness or accuracy.
This Research material was prepared by LPL Financial, LLC.
Securities and advisory services offered through LPL Financial (LPL), a registered investment advisor and broker-dealer (member FINRA/SIPC).
Insurance products are offered through LPL or its licensed affiliates. To the extent you are receiving investment advice from a separately registered independent investment advisor that is not an LPL affiliate, please note LPL makes no representation with respect to such entity.
Not Insured by FDIC/NCUA or Any Other Government Agency
Not Bank/Credit Union Guaranteed
Not Bank/Credit Union Deposits or Obligations
May Lose Value
Market Update: Mon, Jul 6, 2020 | LPL Financial Research
LPL Research in the news. LPL Financial Senior Market Strategist Ryan Detrick was on Bloomberg Radio recently to discuss current market action. (Ryan’s part starts at the 22:00 mark). Additionally, Ryan was quoted on Fox Business. We apologize that the links to these interviews were not included in the July 2 Keeping You Up to Date announcement.
U.S. stocks add to last week’s strong gains. Stocks are picking up where they left off after last week’s 4% rally, as the S&P 500 Index opened sharply higher this morning. US stocks are taking cues from China, where bullish comments from the state-owned media sparked a 5.7% spike in the Shanghai Composite and fueled gains around the world. European stocks are up even more than their American counterparts in midday trading in London.
June jobs report. The US Bureau of Labor Statistics June nonfarm payrolls report revealed the US economy added 4.8 million jobs, ahead of Bloomberg consensus forecasts of 3.2 million, while May’s total was revised up to 2.7 million. Despite the headline beat, permanent job losses continue to tick higher, suggesting the labor market still has room for improvement. We take a closer look at the June jobs report in today’s LPL Research blog.
High-frequency data leveling off. Plateaus in restaurant dining and electricity consumption (daily data), and in jobless claims and same-store sales (weekly), point to a slowing recovery, although mobility and confidence data have continued their steady climb over the past week.
Week ahead. This week’s economic calendar will include auto sales, the non-manufacturing Purchasing Managers’ Index (PMI), job openings and labor turnover, consumer credit, jobless claims, and wholesale inflation.
COVID-19 news. Data on new cases over the holiday weekend may be distorted due to the holiday, although Florida and Texas reported a record number of new cases. Still, as cases skew younger and treatments improve, the continued downward trend in COVID-19 related deaths is encouraging and hospitalizations continue to rise much more gradually than new cases. (Source: The COVID Tracking Project)
IMPORTANT DISCLOSURES
This material is for general information only and is not intended to provide specific advice or recommendations for any individual. There is no assurance that the views or strategies discussed are suitable for all investors or will yield positive outcomes. Investing involves risks including possible loss of principal. Any economic forecasts set forth may not develop as predicted and are subject to change.
References to markets, asset classes, and sectors are generally regarding the corresponding market index. Indexes are unmanaged statistical composites and cannot be invested into directly. Index performance is not indicative of the performance of any investment and do not reflect fees, expenses, or sales charges. All performance referenced is historical and is no guarantee of future results.
Any company names noted herein are for educational purposes only and not an indication of trading intent or a solicitation of their products or services. LPL Financial doesn’t provide research on individual equities.
All information is believed to be from reliable sources; however, LPL Financial makes no representation as to its completeness or accuracy.
All index and market data are from FactSet and MarketWatch.
This Research material was prepared by LPL Financial, LLC.
Securities and advisory services offered through LPL Financial (LPL), a registered investment advisor and broker-dealer (member FINRA/SIPC).
Insurance products are offered through LPL or its licensed affiliates. To the extent you are receiving investment advice from a separately registered independent investment advisor that is not an LPL affiliate, please note LPL makes no representation with respect to such entity.
Not Insured by FDIC/NCUA or Any Other Government Agency
Not Bank/Credit Union Guaranteed
Not Bank/Credit Union Deposits or Obligations
May Lose Value
Market Update: Thur, Jul 2, 2020 | LPL Financial Research
Stocks opened solidly higher. Stocks are adding to very strong gains for the week this morning after a strong June jobs report. Markets continue to shrug off the pause in re-openings in response to rising COVID-19 cases and are focusing more on improving economic data and vaccine prospects. European markets are eclipsing US gains in midday trading in London, while China and Hong Kong paced a 1.5% overall gain in the MSCI Asia Pacific Index overnight.
Another strong jobs report. The US economy added 4.8 million jobs in June, well ahead of Bloomberg’s consensus forecast at 3.2 million, while May’s total was revised up by about 200,000 to 2.7 million. The unemployment rate dropped more than 2 points to 11.1% (consensus was 12.5%), while misclassifications around the “absent from work but employed” issue would add only 1 point (compared with 3 points last month). Though a much smaller upside surprise than last month’s shocker, the job market is clearly coming back stronger than most economists expected.
Manufacturing comeback. The Institute for Supply Management (ISM) Purchasing Manager’s Index (PMI) for manufacturing jumped nearly 10 points in June to 52.6, ahead of Bloomberg’s consensus forecasts and in expansion territory for the first time since the pandemic arrived in the United States. The forward-looking new orders component surged, while supply chain pressures eased. The progress is encouraging, but the road to recover lost output is still a long one.
Weekly Market Performance. We’ll wrap up the week with our review of major index performance later today on the LPL Research blog.
July 4 Holiday Schedule. LPL Financial and the stock and bond markets will be closed Friday, July 3, in observance of the July 4 holiday. Please note:
Daily Market Update will distribute July 2 but not on July 3.
Weekly Market Performance blog will publish after noon ET on July 2; there will not be a morning LPL Research blog July 2 or any blogs on July 3.
COVID-19 news. On Wednesday, US daily cases surpassed 50,000 for the first time on a 45% week-over-week rise. We hope yesterday’s higher positive test rate of 8.5% is not the start of a trend. (Source: The COVID-19 Tracking Project) More reopenings have been pulled back, and more local governments have mandated masks. On a more positive note, vaccine candidates from Pfizer, with German biotech partner BioNTech, and the University of Oxford showed promising results (Source: COVID-19 Tracking Project).
IMPORTANT DISCLOSURES
This material is for general information only and is not intended to provide specific advice or recommendations for any individual. There is no assurance that the views or strategies discussed are suitable for all investors or will yield positive outcomes. Investing involves risks including possible loss of principal. Any economic forecasts set forth may not develop as predicted and are subject to change.
References to markets, asset classes, and sectors are generally regarding the corresponding market index. Indexes are unmanaged statistical composites and cannot be invested into directly. Index performance is not indicative of the performance of any investment and do not reflect fees, expenses, or sales charges. All performance referenced is historical and is no guarantee of future results.
Any company names noted herein are for educational purposes only and not an indication of trading intent or a solicitation of their products or services. LPL Financial doesn’t provide research on individual equities.
All information is believed to be from reliable sources; however, LPL Financial makes no representation as to its completeness or accuracy.
All index and market data are from FactSet and MarketWatch.
This Research material was prepared by LPL Financial, LLC.
Securities and advisory services offered through LPL Financial (LPL), a registered investment advisor and broker-dealer (member FINRA/SIPC).
Insurance products are offered through LPL or its licensed affiliates. To the extent you are receiving investment advice from a separately registered independent investment advisor that is not an LPL affiliate, please note LPL makes no representation with respect to such entity.
Not Insured by FDIC/NCUA or Any Other Government Agency
We check in again today on some of the real-time economic data that LPL Research is monitoring to provide valuable insights into the current state of the US economy, even as traditional economic data is too slow to pick up the changes that are occurring in response to the COVID-19 pandemic.
Much of the high-frequency data is now showing a pause in the steady improvement we had seen since the end of March amid increasing public concern over the recent spike in COVID-19 cases in the US. In the last two weeks, the number of daily new US COVID-19 cases has doubled to over 40,000, largely due to surges in many southern and western states. While this is certainly a concerning development, the sharp increase in confirmed cases has come amid record testing levels (the seven-day average number of tests performed is up 26% in the last two weeks to 590,000). And while Tuesday’s more than 1600 increase in hospitalizations was concerning, thankfully the recent uptrend in the number of people hospitalized has been more gradual than the growth in new cases.
The recovery in many of the real-time indicators appears to have plateaued in the past week, potentially reflecting that the increase in COVID-19 cases has the US consumer reconsidering dining out, shopping in stores, or traveling, where social distancing can be more challenging. Coming off extreme lows of -100% compared to the same time last year, the improvement in the number of diners in US restaurants has leveled off in the past week and is now sitting at about 50% down year on year.
Another piece of high-frequency data showing a potential stall in the recovery is electricity demand, which had recovered toward the end of May as many states re-opened. In the past week, however, demand flattened out potentially indicating a slowdown in the rate at which businesses are reopening or softening demand for their goods/services.
One real-time indicator that has now exceeded pre-pandemic levels is map routing requests by the Apple maps app, meaning more driving is occurring. This data steadily recovered from March/April lows as people returned to work or other economic activity, and now the continued increase is possibly reflecting a substitution effect as people shun public transportation and air travel.
“The fits and starts in the real-time data show that this recovery is probably going to take longer than most of us want to see,” explained LPL Financial Senior Market Strategist Ryan Detrick. “We are on the road to recovery, but it is a road that is going to be pretty bumpy.”
We wish you a happy and safe Fourth of July.
IMPORTANT DISCLOSURES
This material is for general information only and is not intended to provide specific advice or recommendations for any individual. There is no assurance that the views or strategies discussed are suitable for all investors or will yield positive outcomes. Investing involves risks including possible loss of principal. Any economic forecasts set forth may not develop as predicted and are subject to change.
References to markets, asset classes, and sectors are generally regarding the corresponding market index. Indexes are unmanaged statistical composites and cannot be invested into directly. Index performance is not indicative of the performance of any investment and do not reflect fees, expenses, or sales charges. All performance referenced is historical and is no guarantee of future results.
Any company names noted herein are for educational purposes only and not an indication of trading intent or a solicitation of their products or services. LPL Financial doesn’t provide research on individual equities. All information is believed to be from reliable sources; however, LPL Financial makes no representation as to its completeness or accuracy.
This Research material was prepared by LPL Financial, LLC.
Securities and advisory services offered through LPL Financial (LPL), a registered investment advisor and broker-dealer (member FINRA/SIPC).
Insurance products are offered through LPL or its licensed affiliates. To the extent you are receiving investment advice from a separately registered independent investment advisor that is not an LPL affiliate, please note LPL makes no representation with respect to such entity.
If your representative is located at a bank or credit union, please note that the bank/credit union is not registered as a broker-dealer or investment advisor. Registered representatives of LPL may also be employees of the bank/credit union.
These products and services are being offered through LPL or its affiliates, which are separate entities from, and not affiliates of, the bank/credit union. Securities and insurance offered through LPL or its affiliates are:
Not Insured by FDIC/NCUA or Any Other Government Agency
What a quarter the second quarter was, with the S&P 500 Index adding 20.0%, for the best quarter since 1998 and the best second quarter since 1938. Of course, stocks fell 20% in the first quarter, so what we really have is a bad case of whiplash in 2020 thus far.
“A 20% quarterly gain is quite rare, but the catch is previous large quarterly gains have actually led to continued strength,” according to LPL Financial Senior Market Strategist Ryan Detrick. “In fact, a quarter later stocks have been higher the past 8 times after gaining at least 15% during the previous quarter.”
As the LPL Chart of the Day shows, future strong returns are quite normal after a big quarter. Although it might not seem likely given the headlines and magnitude of the current bounce, it is important to be aware that extreme strength usually begets more strength.
Breaking it down more though shows that July has been actually the strongest month during the summer. August and September have tended to be troublesome and dragged the third quarter down.
For more on why what we’ve seen recently is extremely rare, yet could lead to continued gains, read this recent blog post.
IMPORTANT DISCLOSURES
This material is for general information only and is not intended to provide specific advice or recommendations for any individual. There is no assurance that the views or strategies discussed are suitable for all investors or will yield positive outcomes. Investing involves risks including possible loss of principal. Any economic forecasts set forth may not develop as predicted and are subject to change.
References to markets, asset classes, and sectors are generally regarding the corresponding market index. Indexes are unmanaged statistical composites and cannot be invested into directly. Index performance is not indicative of the performance of any investment and do not reflect fees, expenses, or sales charges. All performance referenced is historical and is no guarantee of future results.
Any company names noted herein are for educational purposes only and not an indication of trading intent or a solicitation of their products or services. LPL Financial doesn’t provide research on individual equities. All information is believed to be from reliable sources; however, LPL Financial makes no representation as to its completeness or accuracy.
This Research material was prepared by LPL Financial, LLC.
Securities and advisory services offered through LPL Financial (LPL), a registered investment advisor and broker-dealer (member FINRA/SIPC).
Insurance products are offered through LPL or its licensed affiliates. To the extent you are receiving investment advice from a separately registered independent investment advisor that is not an LPL affiliate, please note LPL makes no representation with respect to such entity.
Not Insured by FDIC/NCUA or Any Other Government Agency