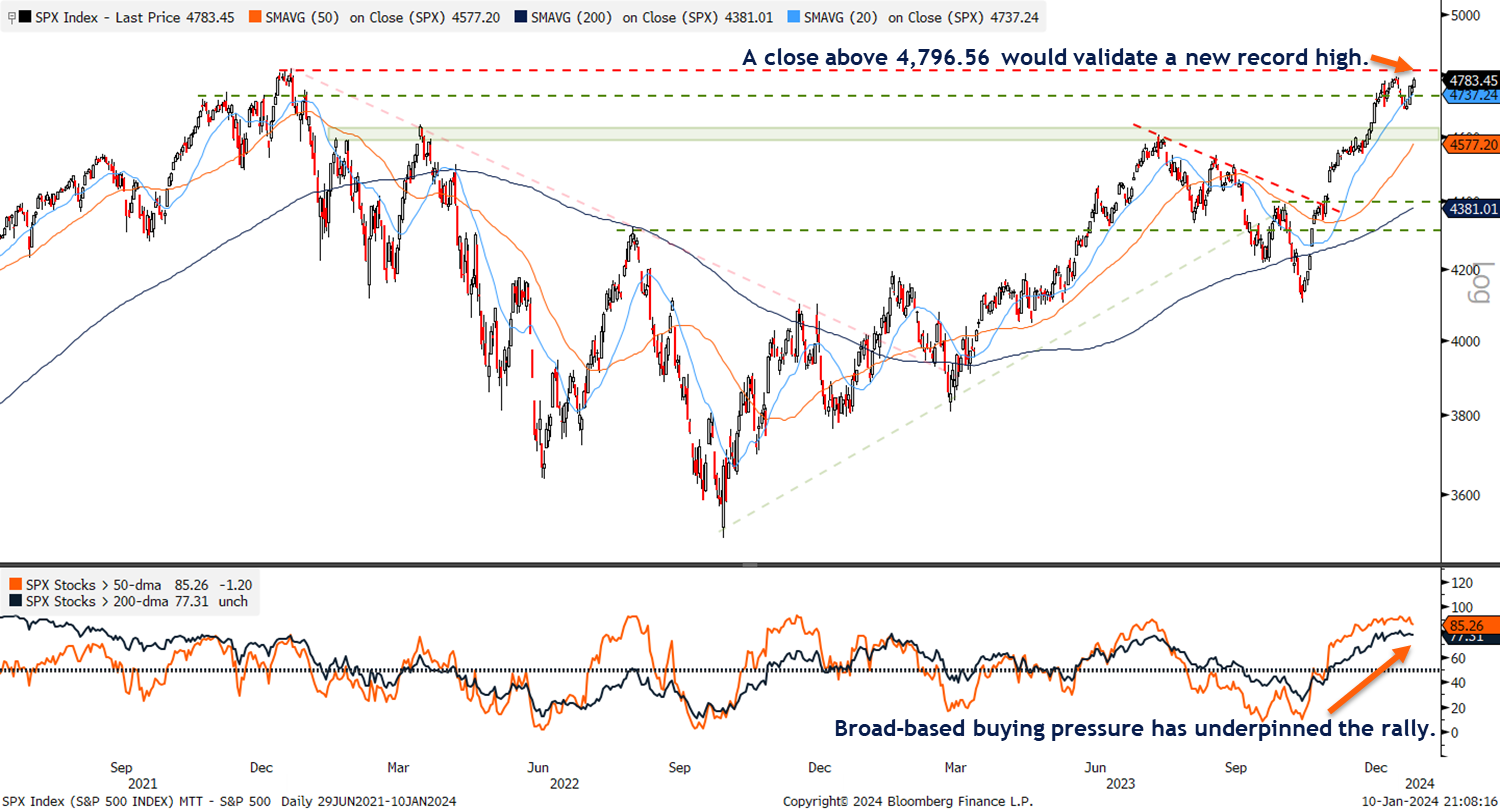
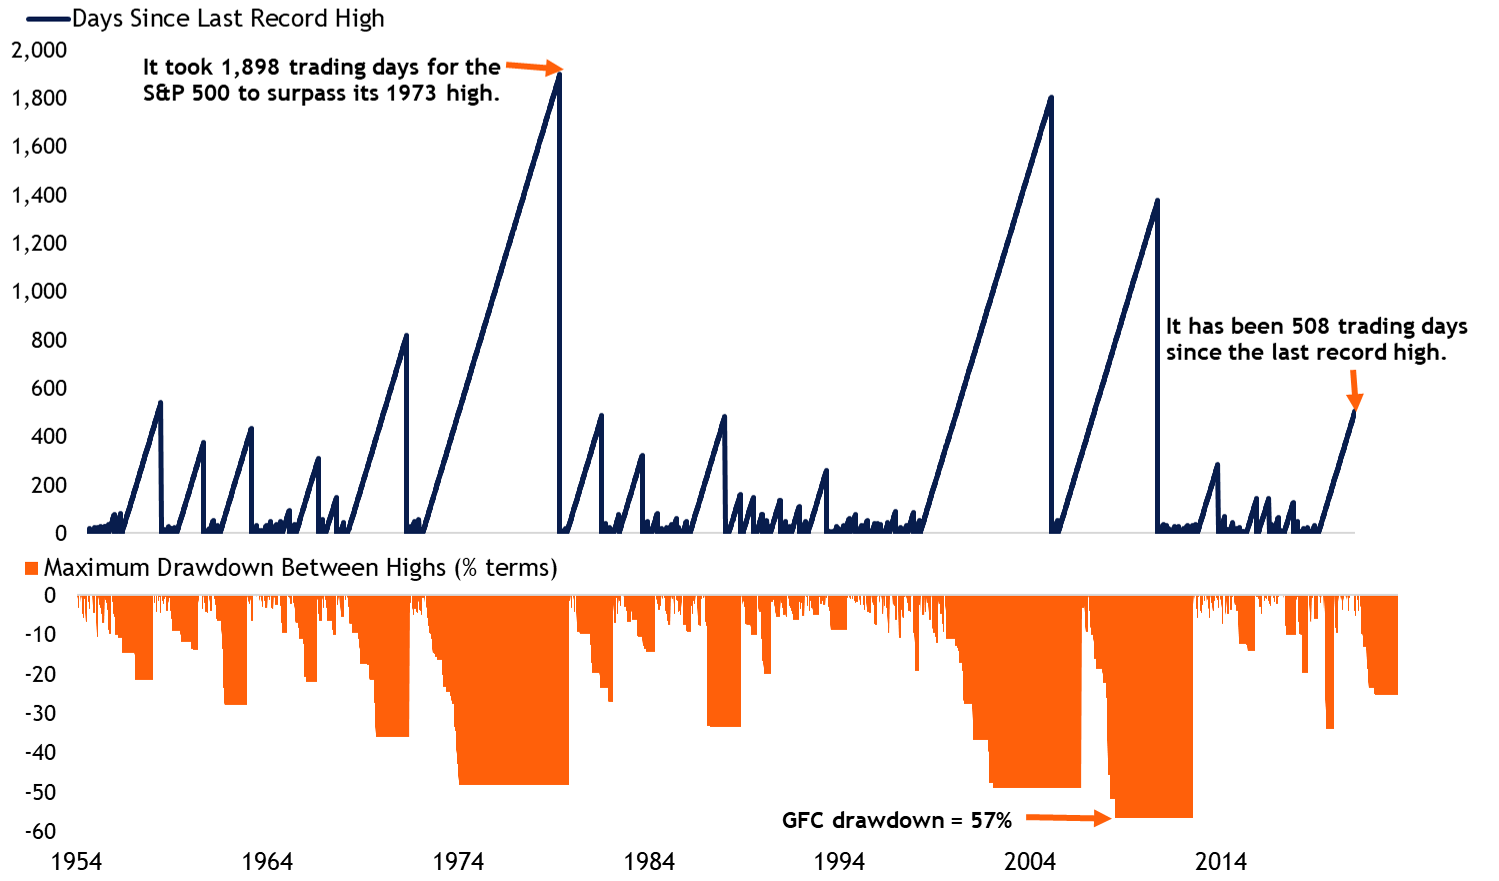
Leading Indicators Signal Caution Over Next Six Months

Posted by Barry Gilbert, PhD, CFA, Asset Allocation Strategist

Thursday, February 23, 2023

The Conference Board’s Leading Economic Index (LEI) for January was released Friday, February 17, 2023. The LEI is an aggregate of 10 economic and market indicators that tend to lead changes in economic activity. The index declined 0.3% for the month and 5.9% for the past year, a slight improvement from the one-year change the previous month. Despite some signs of improvement, the Conference Board noted that their LEI has exhibited the depth, duration, and dispersion that has acted as a reliable indicator of elevated recession risk in the past. (See the Conference Board’s commentary here. For a quick take on the current economic outlook, see LPL Chief Economist Jeffrey Roach’s recent blog here.)

The LEI report left a similar impression as Bloomberg’s latest survey of economists. In the February survey, U.S. and global growth expectations for 2023 had improved but remained tepid. The median estimate of the likelihood of a recession in the next year had ticked down from 65% in January to 60% in February, a positive direction, but still indicating elevated risk. Despite the improvement, a recession remains more likely than not as markets price in more aggressive Federal Reserve policy as it continues to try to tame inflation.

What’s the market takeaway of being in a period of elevated recession risk at current levels? Weakness in leading indicators at roughly the current level have signaled near term risk for markets, with six-month forward returns below average, but looking out over the next year, economic signals may have reached a level where weakness is so readily apparent that it may actually be good for markets in the longer-term. In fact, as shown in the chart below, the current level of the LEI is about where the divergence between historical S&P 500 performance over the next six and twelve months is widest. So indicators suggest choppy markets in the near term but market appreciation by end of the year.

More specifically, we looked at key declining crossovers for the LEI—the one-year change moving below a key level for the first time in over a year. The sample here is small and can be taken only as a rough guide to the potential outlook. Currently, the year-over-year change in the LEI recently crossed below both -5% and -6%, represented by the boxed area below. You can see returns over the next six months (orange line) at this level remain muted, but it is also the level at which returns over the next year (blue line), on average, start to look attractive.

View enlarged chart

Despite the small sample, we think the assessment of market risk historically related to the LEI is sensible and generally in line with other indicators we are watching. There is some reason for optimism one year out, among them that elevated risk of a recession is near consensus, even if the potential damage for higher rates has not worked its way through the economy yet. But near term equity markets may have come too far too fast and the economic outlook still has downside risk. Looking a year out, we maintain cautious optimism, but history says markets may still have some rough patches to get through on the way there.

IMPORTANT DISCLOSURES

This material is for general information only and is not intended to provide specific advice or recommendations for any individual. There is no assurance that the views or strategies discussed are suitable for all investors or will yield positive outcomes. Investing involves risks including possible loss of principal. Any economic forecasts set forth may not develop as predicted and are subject to change.

References to markets, asset classes, and sectors are generally regarding the corresponding market index. Indexes are unmanaged statistical composites and cannot be invested into directly. Index performance is not indicative of the performance of any investment and do not reflect fees, expenses, or sales charges. All performance referenced is historical and is no guarantee of future results.

Any company names noted herein are for educational purposes only and not an indication of trading intent or a solicitation of their products or services. LPL Financial doesn’t provide research on individual equities. All information is believed to be from reliable sources; however, LPL Financial makes no representation as to its completeness or accuracy.

For a list of descriptions of the indexes and economic terms referenced in this publication, please visit our website at lplresearch.com/definitions.

All index and market data from FactSet and MarketWatch.

This Research material was prepared by LPL Financial, LLC.

Securities and advisory services offered through LPL Financial (LPL), a registered investment advisor and broker-dealer (member FINRA/SIPC).

Insurance products are offered through LPL or its licensed affiliates.  To the extent you are receiving investment advice from a separately registered independent investment advisor that is not an LPL affiliate, please note LPL makes no representation with respect to such entity.

  • Not Insured by FDIC/NCUA or Any Other Government Agency
  • Not Bank/Credit Union Guaranteed
  • Not Bank/Credit Union Deposits or Obligations
  • May Lose Value

No Landing = No Sense

Posted by Jeffrey J. Roach, PhD, Chief Economist

Tuesday, February 21, 2023

The “Landing” Analogy

We need to go back a few years to recall the time investors began using the “landing” analogy. During the hot summer of the mid-1990s, the Honorable Alan Greenspan spoke to the Economic Club of New York, where he was introduced as “the pilot we are all counting on for that very smooth and we hope very soft landing.”[1]

Perhaps that was not the first time market watchers used the term, but the conversations at the Economic Club of New York were prescient. The hope for a soft landing came to fruition. The economy started overheating in 1994, so the former chairman of the Federal Reserve (Fed) raised rates, cooled the overheated economy, and the country escaped a second recession that decade.

View enlarged chart

What is a Soft Landing?

A soft landing is when economic growth slows but remains positive as the economy sets up for a long-term sustainable growth path. In contrast, a hard landing means the country falls into recession to break the overheated economic machine. One assumption behind the analogy is an overheated economy is not on a sustainable growth path so policy makers ought to tighten financial conditions to improve the chances the economy can maintain a stable growth rate.

Why a “No Landing” Makes No Sense.

Suggesting an economy makes “no landing” makes no sense. Analogies eventually break down, especially this one. Economic activity does not stop like an airplane eventually does, but rather the economy eventually settles in a steady state where growth is consistent with factors such as population and productivity.

So perhaps it’s time to rethink. One suggestion is using the analogy of a runner. Runners often talk about the various phases of the race. One important phase is when runners transition from the acceleration phase, when runners focus on increasing stride length and frequency, to a steady state, when runners focus on maintaining stride length and frequency over time.

What does this mean for you?

The Fed wants to tighten financial conditions so the economy can smoothly transition from the post-pandemic reopening phase, when the economy grew 5.9% in 2021 and 2.1% in 2022, to a more sustainable rate that neither stokes inflation nor stalls economic growth.

If the economy can break the back of inflation without a deep and prolonged recession, investors will likely experience markets that could return to lower volatility and improved conditions for both bond and equity investors. We think this could be a likely outcome, notwithstanding unforeseen global shocks.

[1] https://www.econclubny.org/documents/10184/109144/1995GreenspanTranscript.pdf

IMPORTANT DISCLOSURES

This material is for general information only and is not intended to provide specific advice or recommendations for any individual. There is no assurance that the views or strategies discussed are suitable for all investors. To determine which investment(s) may be appropriate for you, please consult your financial professional prior to investing.

Investing involves risks including possible loss of principal. No investment strategy or risk management technique can guarantee return or eliminate risk in all market environments. For more information on the risks associated with the strategies and product types discussed please visit https://lplresearch.com/Risks  

References to markets, asset classes, and sectors are generally regarding the corresponding market index. Indexes are unmanaged statistical composites and cannot be invested into directly. Index performance is not indicative of the performance of any investment and do not reflect fees, expenses, or sales charges. All performance referenced is historical and is no guarantee of future results.

Unless otherwise stated LPL Financial and the third party persons and firms mentioned are not affiliates of each other and make no representation with respect to each other. Any company names noted herein are for educational purposes only and not an indication of trading intent or a solicitation of their products or services.

All information is believed to be from reliable sources; however, LPL Financial makes no representation as to its completeness or accuracy.

Securities and advisory services offered through LPL Financial, a registered investment advisor and broker-dealer. Member FINRA/SIPC.

Foundation Set for a Bottom in Homebuilders

Posted by Adam Turnquist, CMT, VP Chief Technical Strategist

Friday, February 17, 2023

Key Conclusions:

  • Homebuilder stocks continue to advance despite underwhelming housing data. We suspect this represents price leading fundamentals.
  • While mortgage rates have receded over the last several months, housing starts and building permits have yet to improve. A recovery in the forward-looking building permits data would be a bullish sign for the sector and the broader equity market.
  • One area of housing data that may have bottomed is builder sentiment, which recently advanced after a 12-month losing streak last year. A bottom in builder sentiment has historically coincided with equity market bottoms.
  • The technical setup for homebuilder stocks remains bullish despite the underwhelming housing data. The Dow Jones U.S. Select Home Builders Index broke out from a bottom earlier this year and is now trending higher. We believe the rally has more room to run.

Housing market data and homebuilder stocks have diverged over the last several months. Rising interest rates and the subsequent spillover into mortgage rates poured cold water on the post-pandemic housing market melt-up. The national average 30-year fixed rate mortgage jumped from 3.27% at the start of 2022 to a multi-decade high of 7.35% in November. Housing prices dropped across the country, while groundbreaking on new homes and building permits plummeted, albeit from multi-year highs.

While mortgage rates, highlighted in the top panel of the chart below, have receded over the last several months, housing data has shown no signs of an inflection point. Housing starts, shown below in orange, fell 4.5% in January to a seasonally adjusted annual rate of 1.31 million, marking the longest monthly losing streak since 2009. The more forward-looking building permits data, shown below in blue, held steady last month as an uptick in multifamily permits offset a decline in the single-family category. The big question now is if mortgage rates have peaked, when will housing market data finally start to improve? The rally in housing-related stocks suggests a bottom could be near.

View enlarged chart

A Bottom in Builder Sentiment?

One area of housing data that may be bottoming is builder sentiment. As a backdrop, the National Association of Home Builders (NAHB) Housing Market Index (HMI) declined for 12 straight months last year, as builders dealt with rising construction costs, cancellations due to affordability constraints, and snarled supply chains. However, the streak of deteriorating builder sentiment finally ended in January, and the NAHB HMI has now posted back-to-back monthly gains. The latest NAHB report released on Wednesday, February 15, noted, “While we expect ongoing volatility for mortgage rates and housing costs, the building market should be able to achieve stability in the coming months, followed by a rebound back to trend home construction levels later in 2023 and the beginning of 2024.” The chart below highlights the NAHB Index and its three components, which have all inflected higher near pandemic-era lows.

View enlarged chart

What Does This Mean for Stocks?

A bottom in builder sentiment would be a bullish sign for stocks. Four of the five major bottoms in the NAHB HMI since its inception in 1985 occurred near market bottoms (2001 was an early signal).

Four of the five periods also overlapped with a recession. The exception was the bottom in 1995, which coincided with a Federal Reserve soft landing. The chart below highlights each period along with how the S&P 500 and homebuilder stocks performed after each major NAHB HMI low. Of course this data comes with the asterisk of limited occurrences and the benefit of hindsight in determining the NAHB HMI lows. Nonetheless, returns for both the S&P 500 and its homebuilding subindustry group are impressive.

View enlarged chart

Finally, the technical setup for homebuilder stocks remains bullish despite all of the underwhelming housing data. As shown below, the Dow Jones U.S. Select Home Builders Index (DJSHMB) broke out from a bottom earlier this year and is now trending higher. Overbought conditions related to the breakout have eased, setting up a pullback opportunity at the uptrend support line. Relative strength for the index also remains bullish as the DJSHMB has been outperforming the S&P 500 since April 2022. While the DJSHMB has made an impressive comeback over the last several months, we believe the rally could continue back toward the 2021 highs near 14,900, representing nearly 20% of potential upside from current levels.

View enlarged chart

IMPORTANT DISCLOSURES

This material is for general information only and is not intended to provide specific advice or recommendations for any individual. There is no assurance that the views or strategies discussed are suitable for all investors. To determine which investment(s) may be appropriate for you, please consult your financial professional prior to investing.

Investing involves risks including possible loss of principal. No investment strategy or risk management technique can guarantee return or eliminate risk in all market environments. For more information on the risks associated with the strategies and product types discussed please visit https://lplresearch.com/Risks  

References to markets, asset classes, and sectors are generally regarding the corresponding market index. Indexes are unmanaged statistical composites and cannot be invested into directly. Index performance is not indicative of the performance of any investment and do not reflect fees, expenses, or sales charges. All performance referenced is historical and is no guarantee of future results.

Unless otherwise stated LPL Financial and the third party persons and firms mentioned are not affiliates of each other and make no representation with respect to each other. Any company names noted herein are for educational purposes only and not an indication of trading intent or a solicitation of their products or services.

All information is believed to be from reliable sources; however, LPL Financial makes no representation as to its completeness or accuracy.

Securities and advisory services offered through LPL Financial, a registered investment advisor and broker-dealer. Member FINRA/SIPC.

Debt Ceiling Standoff Back in Focus

Posted by George Smith, CFA, CAIA, CIPM, Portfolio Strategist

Thursday, February 16, 2023

The debt limit—commonly called the debt ceiling—is the maximum amount of debt the Treasury Department is authorized to borrow to pay its already committed financial obligations. The amount is set through Congress and has been increased 78 times since 1960. Last raised by $2.5 trillion to $31.4 trillion in December 2021, the debt ceiling is back in focus as the ceiling was breached again on January 19. Treasury Secretary Janet Yellen, informed Congress that pending an increase to the debt ceiling, the department would have to enter into “extraordinary measures” to avoid defaulting on its obligations—essentially suspending reinvestments into certain programs and shuffling money around.

Yesterday, the Congressional Budget Office (CBO) released a statement projecting that the ability of these extraordinary measures to be effective would be exhausted between July and September of this year. If income tax receipts are lower than expected, for example if capital gains realizations in 2022 were less than CBO estimates, then the CBO stated the Treasury could actually run out of funds before July. Secretary Yellen previously noted the Treasury could fail to meet obligations in June.

We have seen standoffs over the debt ceiling play out in Washington many times before, but with razor thin majorities in both the House and Senate finding agreement may be particularly fraught. President Biden has said he will settle for nothing less than a no-strings attached increase, while House Republicans, concerned about overall levels of debt, have suggested they want a condition of raising the ceiling to be reductions in federal spending. As shown in the LPL Chart of the Day, the total U.S. debt outstanding has almost doubled in the past 10 years and tripled in the last 15.

View enlarged chart

If the debt ceiling isn’t increased, the U.S. Government would technically default on its contractual obligations eventually. Once extraordinary measures were exhausted the Treasury would be forced to either undertake prioritization (making some payments not others) or to default on all debt (refusing to make any payments until it could make all), with the latter likely to cause more chaos for financial markets. Some more off-the-wall solutions floated around have included the Treasury minting a trillion dollar platinum coin, issuing debt with extremely high coupons, or through the Public Debt Clause found in the 14th Amendment, which some have interpreted to allow the Treasury to continue to issue debt to prevent default. However, the White House and Secretary Yellen have commented in the past that most of those options are not viable.

U.S. bond market investors have largely taken for granted the government’s ability and willingness to pay its debt. While its ability to repay its obligations is not in question, the debt ceiling debate complicates the country’s willingness to pay its debts. In 2011, Congress waited until the very last minute to fix the debt ceiling issues and S&P downgraded the country’s debt rating to AA+ from AAA because of the questions surrounding that willingness to pay its obligations. Another debt downgrade, much less an actual default, would likely be extremely disruptive to financial markets.

Our base case is still that Congress will act in time to either raise or suspend the debt ceiling; however, in the meantime, the closer the political brinksmanship allows the standoff get to the point of default, the more unnecessary volatility we are likely to see in markets.

IMPORTANT DISCLOSURES

This material is for general information only and is not intended to provide specific advice or recommendations for any individual. There is no assurance that the views or strategies discussed are suitable for all investors or will yield positive outcomes. Investing involves risks including possible loss of principal. Any economic forecasts set forth may not develop as predicted and are subject to change.

References to markets, asset classes, and sectors are generally regarding the corresponding market index. Indexes are unmanaged statistical composites and cannot be invested into directly. Index performance is not indicative of the performance of any investment and do not reflect fees, expenses, or sales charges. All performance referenced is historical and is no guarantee of future results.

Any company names noted herein are for educational purposes only and not an indication of trading intent or a solicitation of their products or services. LPL Financial doesn’t provide research on individual equities. All information is believed to be from reliable sources; however, LPL Financial makes no representation as to its completeness or accuracy.

For a list of descriptions of the indexes and economic terms referenced in this publication, please visit our website at lplresearch.com/definitions.

All index and market data from FactSet and MarketWatch.

This Research material was prepared by LPL Financial, LLC.

Securities and advisory services offered through LPL Financial (LPL), a registered investment advisor and broker-dealer (member FINRA/SIPC).

Insurance products are offered through LPL or its licensed affiliates.  To the extent you are receiving investment advice from a separately registered independent investment advisor that is not an LPL affiliate, please note LPL makes no representation with respect to such entity.

  • Not Insured by FDIC/NCUA or Any Other Government Agency
  • Not Bank/Credit Union Guaranteed
  • Not Bank/Credit Union Deposits or Obligations
  • May Lose Value

Is Cash Worth the (Reinvestment) Risk

Posted by Lawrence Gillum, CFA, Fixed Income Strategist

Wednesday, February 15, 2023

Economists like to remind us there is no such thing as a free lunch. In investment parlance, that just means all investments carry risk—even cash. After last year’s aggressive rate hiking campaign from the Federal Reserve (Fed), short-term interest rates are at levels last seen in 2007. Moreover, due to the elevated fed funds rate and the subsequent carryover into the U.S. Treasury market, the Treasury yield curve is the most inverted since the early 1980s (that is shorter-term Treasury securities out yield longer maturity securities). As seen on the chart below, yields on Treasury securities that mature in one year or less are approaching 5%, which is up significantly since the end of 2021. This has (finally) allowed investors to generate a return on cash—and investors have taken notice. According to ICI, a company that tracks investment flows, nearly $5 trillion is sitting in money market assets, which is double the amount pre-COVID-19. So where is the risk that economist warn us about? The big risk with cash is reinvestment risk. That is, while short-term rates are currently elevated, the risk is that these rates won’t last and upon maturity, investors will have to reinvest proceeds at lower rates.

View enlarged chart

The Fed continues to fight elevated inflationary pressures by raising short-term interest rates. Over the past 12 months, the Fed has taken its fed funds rate to 4.75% (upper bound), and they may not be done yet either. Markets are currently pricing in at least two more 0.25% rate hikes over the next few months, which would take the rate to 5.25%—the highest level since 2007. The Fed’s goal has been to take the fed funds rate into restrictive territory to make the cost of capital prohibitively expensive to slow aggregate demand, which will allow inflationary pressures to abate. Then what? Well, after winning its fight with inflation, markets expect the Fed to start cutting rates next year. After keeping rates at these elevated levels, the Fed will likely take the fed fund rate back to a more neutral level, which economists believe is 2.5%. Just as the aggressive rate hiking cycle took Treasury yields higher, interest rate cuts will take all Treasury (and other bond market) yields lower—that is when the reinvestment risks of investing in cash will show up.

Below is a simple exercise that looks at the outcomes of an investor who allocates $1,000,000 in cash and then rolls over the investment proceeds at maturity back into cash at the prevailing interest rates, versus investing in a core bond strategy that is yielding 4.6% (which is the current yield on the Bloomberg Aggregate Bond Index). Over shorter horizons, certainly cash is an attractive option, but for investors with a three to five year time horizon, the difference in sticking with cash versus owning intermediate maturity fixed income instruments is pretty meaningful.

View enlarged chart

While we certainly think cash is a legitimate asset class again, unless investors have short-term income needs, they may be better served by reducing some of their excess cash holdings and by extending the maturity profile of their fixed income portfolio to lock in these higher yields for longer. Bond funds and ETFs that track the Bloomberg Aggregate Index, along with separately managed accounts and laddered portfolios, all represent attractive options that will allow investors to take advantage of these higher rates before they disappear.

IMPORTANT DISCLOSURES

This material is for general information only and is not intended to provide specific advice or recommendations for any individual. There is no assurance that the views or strategies discussed are suitable for all investors. To determine which investment(s) may be appropriate for you, please consult your financial professional prior to investing.

Investing involves risks including possible loss of principal. No investment strategy or risk management technique can guarantee return or eliminate risk in all market environments. For more information on the risks associated with the strategies and product types discussed please visit https://lplresearch.com/Risks  

References to markets, asset classes, and sectors are generally regarding the corresponding market index. Indexes are unmanaged statistical composites and cannot be invested into directly. Index performance is not indicative of the performance of any investment and do not reflect fees, expenses, or sales charges. All performance referenced is historical and is no guarantee of future results.

Unless otherwise stated LPL Financial and the third party persons and firms mentioned are not affiliates of each other and make no representation with respect to each other. Any company names noted herein are for educational purposes only and not an indication of trading intent or a solicitation of their products or services.

All information is believed to be from reliable sources; however, LPL Financial makes no representation as to its completeness or accuracy.

Securities and advisory services offered through LPL Financial, a registered investment advisor and broker-dealer. Member FINRA/SIPC.

An Uneven Path to Two Percent

Posted by Jeffrey J. Roach, PhD, Chief Economist

Tuesday, February 14, 2023

The Uneven Path

For most categories, inflation is decidedly past peak. But as we see from today’s report, the pathway back down to the Federal Reserve’s (Fed) target of 2%, will be choppy. In January, the U.S. Consumer Price Index (CPI) rose 0.5% from a month ago, driven up by shelter costs. Higher shelter costs contributed roughly half of the monthly gain in prices during the month. Other contributors to the upward rise in prices were groceries, restaurants, and energy costs.

Not all categories rose during the month. Medical care services fell for three out of the last four months. Used cars and trucks also continue to decline. In a dramatic reversal from the previous years, used cars and truck prices are down over 11% from a year ago.

Overall, the annual inflation rate dipped down to 6.4% in January from 6.5% the previous month. The annual rate is now the lowest it has been since October 2021, as shown in the chart below. Revisions showed inflation was slightly hotter than initially reported, and adding risk that a resurgence in pricing pressures is a possibility if demand does not adequately slow.

As the global economy is in the process of finding balance, investors should expect a bumpy ride back down to pre-pandemic inflation rates. Because some sectors are still recalibrating, the risks are high that inflation does not come down as fast as the markets expect.

View enlarged chart

Where are the Risks?

The two main risks in the markets right now surround China and the domestic consumer. First, investors should carefully watch the reopening process in China. If the Chinese economy grows faster than expected, global inflation–and by extension U.S. inflation–could run hotter for longer than expected. Second, the strength of the labor market implies consumer demand could stay elevated this year. The Fed communicated there is more work to do in raising rates, so the risk for this year is that higher rates might not slow consumer demand enough for inflation to ease consistently.

View enlarged chart

What Does This Mean for You?

As of 2023, the Bureau of Labor Statistics (BLS) is now updating the spending weights within the CPI report every year instead of every two years. The goal is to have a more accurate measure of pricing pressures on the average household, but the CPI improvements will not likely change the Fed’s preference for the deflator from the Bureau of Economic Analysis (BEA) personal income and spending report.

Most relevant for the average consumer, rising prices mean lower purchasing power. Adjusted for inflation, real average hourly earnings fell 1.8% from a year ago. For many people, wage growth has not kept up with inflation, eroding purchasing power for many Americas.

Inflation is easing but the path to lower inflation will not likely be smooth. The Fed will not make decisions based on just one report, but clearly the risks are rising that inflation will not cool fast enough for the Fed’s liking.

Looking ahead, rents should be less of a driver for inflation as new rent prices have declined for the last several months and should eventually filter into the official inflation statistics from the BLS.

Globally, investors should know that China’s growth path for 2023 puts upside risk to inflation expectations. But according to the University of Michigan’s benchmark survey, long-term inflation expectations are well-anchored at 2.9%, unchanged for the third consecutive month and this supports the view that the Fed will hike by 0.25% at the next meeting and not revert to larger rate hikes.

Not all risks are to the upside. If the economy can boost productivity this year, we could see a repeat of the 1990s when core services inflation fell despite higher labor costs. For more on the role of productivity growth in softening sticky inflation, watch this week’s Econ Market Minute here.

https://youtube.com/watch?v=Ye7W4yCgg5Y%3Fversion%3D3%26rel%3D1%26showsearch%3D0%26showinfo%3D1%26iv_load_policy%3D1%26fs%3D1%26hl%3Den-US%26autohide%3D2%26wmode%3Dtransparent

IMPORTANT DISCLOSURES

This material is for general information only and is not intended to provide specific advice or recommendations for any individual. There is no assurance that the views or strategies discussed are suitable for all investors. To determine which investment(s) may be appropriate for you, please consult your financial professional prior to investing.

Investing involves risks including possible loss of principal. No investment strategy or risk management technique can guarantee return or eliminate risk in all market environments. For more information on the risks associated with the strategies and product types discussed please visit https://lplresearch.com/Risks  

References to markets, asset classes, and sectors are generally regarding the corresponding market index. Indexes are unmanaged statistical composites and cannot be invested into directly. Index performance is not indicative of the performance of any investment and do not reflect fees, expenses, or sales charges. All performance referenced is historical and is no guarantee of future results.

Unless otherwise stated LPL Financial and the third party persons and firms mentioned are not affiliates of each other and make no representation with respect to each other. Any company names noted herein are for educational purposes only and not an indication of trading intent or a solicitation of their products or services.

All information is believed to be from reliable sources; however, LPL Financial makes no representation as to its completeness or accuracy.

Securities and advisory services offered through LPL Financial, a registered investment advisor and broker-dealer. Member FINRA/SIPC.

Are Bears Finally Going Into Hibernation?

Posted by Adam Turnquist, CMT, VP Chief Technical Strategist

Friday, February 10, 2023

Negative sentiment has been an ongoing theme throughout this bear market. Continuous monetary tightening, surging interest rates and inflation, and slowing growth have been a few catalysts behind the widespread pessimism. However, with stocks staging an impressive comeback since the start of the year, there have been recent signs of bears finally going into hibernation.

Since 1987, the American Association of Individual Investors (AAII) has surveyed its members each week with a simple question: “Do you feel the direction of the stock market over the next six months will be up (bullish), no change (neutral) or down (bearish)?” The bullish, bearish, and neutral percentage readings provide a temperature gauge for risk appetite among investors. Investors also use the readings as contrarian indicators when bullish and bearish sentiment reaches extremes.

The chart below breaks down the weekly AAII bullish (top) and bearish (middle) percent readings, along with the spread between the data series shown in the bottom panel (Bull-Bear Index).

View enlarged chart

Bullish sentiment has been trending higher since the start of the year, lifting the bullish percent from 20.5% at the beginning of the year to 37.5% as of Thursday, February 9. While this has been a welcomed improvement, the most recent reading is only back to its long-term average (green dotted line at 37.5%).

Bearish sentiment remained stubbornly high throughout most of last year. However, sentiment started to slip as the calendar turned to 2023. The current reading of 25.0% marks the lowest level of bearish sentiment since November 2021.

Comparing sentiment between bulls and bears highlights how consistent bearish sentiment has been over the last year. In fact, the Bull-Bear index (bullish minus bearish sentiment) turned positive this week for the first time in 45 weeks, ending the longest streak of negative readings on record.

What does this mean for stocks? We analyzed how the market performed after a prolonged period of bearish sentiment ended. We defined a prolonged period as eight straight weeks or more of bearish sentiment exceeding bullish sentiment. The table below provides a breakdown of the results.

View enlarged chart

Historically, after these streaks end and bullish sentiment outpaces bearish sentiment, the S&P 500 has historically generated positive returns. On a 12-month basis, the index produced respective average and median returns of 11.8% and 14.0%, with 13 of the 16 periods yielding positive returns. For reference, the S&P 500 has generated average 12-month rolling returns of 9.1% with a 77% positivity rate since 1987.

In conclusion, bears finally appear to be hibernating as bullish sentiment improves. Historically, the end of prolonged periods of bearish sentiment has usually led to above-average market returns over the next twelve months. While sentiment is clearly not a science and is often best utilized as a contrarian indicator, the recent transition toward improving optimism suggests investors are becoming more confident with the latest recovery in stocks, something absent from prior recovery periods in 2022.

IMPORTANT DISCLOSURES

This material is for general information only and is not intended to provide specific advice or recommendations for any individual. There is no assurance that the views or strategies discussed are suitable for all investors. To determine which investment(s) may be appropriate for you, please consult your financial professional prior to investing.

Investing involves risks including possible loss of principal. No investment strategy or risk management technique can guarantee return or eliminate risk in all market environments. For more information on the risks associated with the strategies and product types discussed please visit https://lplresearch.com/Risks  

References to markets, asset classes, and sectors are generally regarding the corresponding market index. Indexes are unmanaged statistical composites and cannot be invested into directly. Index performance is not indicative of the performance of any investment and do not reflect fees, expenses, or sales charges. All performance referenced is historical and is no guarantee of future results.

Unless otherwise stated LPL Financial and the third party persons and firms mentioned are not affiliates of each other and make no representation with respect to each other. Any company names noted herein are for educational purposes only and not an indication of trading intent or a solicitation of their products or services.

All information is believed to be from reliable sources; however, LPL Financial makes no representation as to its completeness or accuracy.

Securities and advisory services offered through LPL Financial, a registered investment advisor and broker-dealer. Member FINRA/SIPC.

A Short and Shallow Recession: How It Could Play Out

Posted by Jeffrey J. Roach, PhD, Chief Economist

Tuesday, February 7, 2023

Recession Lengths Vary Widely

Recessions occur when the economy has reached a peak in economic activity and it is heading toward the subsequent trough. The economy is back in expansion mode after the trough. Although it sounds obvious, investors should remember the economy is mostly in expansion—recessions are not the norm.

Since 1945, as illustrated in the table below, the average length of a recession is roughly 10 months. Depending on the cause of recession, lengths vary widely. The most recent recession was initiated by the government’s desire to squelch the transmission of COVID-19. As authorities shuttered businesses and told consumers to “shelter in place,” the economy came to a virtual standstill. But the recession did not last long. Just two months later, the economy resumed growth after experiencing the shortest recession on record.

In contrast to the most recent recession, the Great Financial Crisis was a recession caused by fundamental flaws in credit markets and pushed the economy into a decline that did not end until 18 months later.

View enlarged chart

Short and Shallow?

A potential recession this year will likely be shorter than the post-war average because consumers appear to be on better footing with access to a hot labor market and still holding onto a large amount of cash. Unemployment rates are at historic lows, job openings are still very high, and checkable deposits and money market accounts are flush with cash. Of course, these statements are made in the aggregate and do not account for the immense economic challenges felt by lower income households during this period of stubbornly high inflation.

The likelihood of a recession this year is not due to fundamental flaws in the credit markets, nor are we forecasting a resurgence of a global pandemic. Rather, we think the risk of a recession in 2023 is due to a pullback in consumer spending as households become more timid about economic uncertainty. Due to these reasons, a potential recession in 2023 will likely be short and shallow.

Conclusion: What Does This Mean for You?

Higher risks of a recession push businesses into cost-cutting mode. According to the past 12 months of layoff announcements, businesses are thinning payrolls because of cost-cutting and a downturn in demand. Business capital spending on items such as computers, machinery, and other business equipment often slows during the beginning of a recession. Shipments of capital goods, excluding aircraft, declined in November and December and that trend will likely continue as recession risks increase.

Investors should know that in the past several business cycles, equity markets (S&P 500) often fall before a recession officially starts and begin to recover before the recession ends. So if the economy ends up falling into a shorter-than-average recession during the first part of this year, investors will likely be rewarded by the end of the year for taking on risk in their portfolios.

IMPORTANT DISCLOSURES

This material is for general information only and is not intended to provide specific advice or recommendations for any individual. There is no assurance that the views or strategies discussed are suitable for all investors. To determine which investment(s) may be appropriate for you, please consult your financial professional prior to investing.

Investing involves risks including possible loss of principal. No investment strategy or risk management technique can guarantee return or eliminate risk in all market environments. For more information on the risks associated with the strategies and product types discussed please visit https://lplresearch.com/Risks  

References to markets, asset classes, and sectors are generally regarding the corresponding market index. Indexes are unmanaged statistical composites and cannot be invested into directly. Index performance is not indicative of the performance of any investment and do not reflect fees, expenses, or sales charges. All performance referenced is historical and is no guarantee of future results.

Unless otherwise stated LPL Financial and the third party persons and firms mentioned are not affiliates of each other and make no representation with respect to each other. Any company names noted herein are for educational purposes only and not an indication of trading intent or a solicitation of their products or services.

All information is believed to be from reliable sources; however, LPL Financial makes no representation as to its completeness or accuracy.

Securities and advisory services offered through LPL Financial, a registered investment advisor and broker-dealer. Member FINRA/SIPC.

Markets Off to a Strong Start in 2023, but Can It Continue?

Posted by Barry Gilbert, PhD, CFA, Asset Allocation Strategist

Thursday, February 2, 2023

The first month of 2023 is now behind us and it felt very different than 2022. In 2022, the S&P 500 and the Bloomberg U.S. Aggregate Bond Index (“Agg”) both fell and there was much talk of the demise of the “60/40” portfolio (a portfolio of 60% stocks and 40% bonds). But the S&P 500 and the Agg were not only both higher in January, they were both in the top 10% of all monthly returns going back to 1980.

The S&P 500 finished January 6.3% higher on a total return basis. That’s the third time in the last four months it was up more than 5%. (Granted, December 2022 was down more than 5%.) A cluster of monthly returns up more than 5% like this is relatively unusual, with gains of more than 5% in three out of four months occurring only eight times since 1980. That’s a small sample and a 5% gain is a somewhat arbitrary line, but nevertheless it’s still noteworthy that returns in the ensuing three-, six-, and twelve-month periods were usually quite good. In fact, as shown in the LPL Chart of the Day, the next twelve months were higher at least 10% every time on a total return basis, with an average gain of over 17%. LPL Research’s asset allocation committee continues to recommend an overweight allocation to equities on the premise market participants may look past a heavily anticipated potential recession in the first half of 2023, even if there may be a pick-up in near-term volatility if a recession should occur.

View enlarged chart

Some other highlights of the January return environment:

  • The consumer discretionary and communication services sectors were the top two performing sectors in January, after being the worst performers in 2022. LPL Research’s asset allocation committee continues to recommend underweights to those sectors, but we are watching the environment closely.
  • Long maturity Treasuries have been on a tear over the last three months, the Bloomberg U.S. Long Treasury Index returning over 12% in November 2022–January 2023. Our asset allocation committee shifted its recommended interest rate sensitivity from underweight, compared to the Agg benchmark, to neutral at the beginning of October 2022. While we aren’t chasing long maturity bonds, we think an emphasis on shorter-maturity bonds in a diversified portfolio is no longer merited.
  • While Agg returns weren’t as spectacular as long Treasuries, the Agg saw a total return of over 6% over the last three months, the best three-month period since January 2009.
  • The MSCI EAFE Index and MSCI Emerging Market Index both outpaced the S&P 500 in January. EAFE has outperformed the S&P 500 Index over the twelve months ending January 31 and our asset allocation committee has warmed to international equities as economic news that has been “less bad than feared” challenges the level of pessimism that had been priced in to international markets.
  • Growth-style domestic stocks outperformed value-style stocks for the first time in six months, as measured by the Russell 1000 Value and Growth indexes. The five-month streak of value outperforming growth that ended in December 2022 is the longest since November 2008.

It’s been an encouraging start to the year after the challenges of 2022. Undoubtedly, 2023 will provide its share of market ups and downs and there are plenty of risks to monitor closely, including a possible recession, continued tightening by the Federal Reserve, still high inflation despite strong signs that it’s settling down, and the conflict in Ukraine. But after 2022, it’s good to have a solid month in the books to start the year.

IMPORTANT DISCLOSURES

This material is for general information only and is not intended to provide specific advice or recommendations for any individual. There is no assurance that the views or strategies discussed are suitable for all investors or will yield positive outcomes. Investing involves risks including possible loss of principal. Any economic forecasts set forth may not develop as predicted and are subject to change.

References to markets, asset classes, and sectors are generally regarding the corresponding market index. Indexes are unmanaged statistical composites and cannot be invested into directly. Index performance is not indicative of the performance of any investment and do not reflect fees, expenses, or sales charges. All performance referenced is historical and is no guarantee of future results.

Any company names noted herein are for educational purposes only and not an indication of trading intent or a solicitation of their products or services. LPL Financial doesn’t provide research on individual equities. All information is believed to be from reliable sources; however, LPL Financial makes no representation as to its completeness or accuracy.

For a list of descriptions of the indexes and economic terms referenced in this publication, please visit our website at lplresearch.com/definitions.

All index and market data from FactSet and MarketWatch.

This Research material was prepared by LPL Financial, LLC.

Securities and advisory services offered through LPL Financial (LPL), a registered investment advisor and broker-dealer (member FINRA/SIPC).

Insurance products are offered through LPL or its licensed affiliates.  To the extent you are receiving investment advice from a separately registered independent investment advisor that is not an LPL affiliate, please note LPL makes no representation with respect to such entity.

  • Not Insured by FDIC/NCUA or Any Other Government Agency
  • Not Bank/Credit Union Guaranteed
  • Not Bank/Credit Union Deposits or Obligations
  • May Lose Value

Are Yields Pointing to a Change in Monetary Policy?

Posted by Adam Turnquist, CMT, VP Chief Technical Strategist

Friday, January 27, 2023

The spotlight will shift from earnings to the Federal Reserve (Fed) next week as they wrap up their 2-day monetary policy meeting on Wednesday, February 1. Market expectations are set for an increase of 25 basis points (bps) in the fed funds rate, which would shift the Fed’s target range up to 4.50%–4.75% from 4.25%–4.50%. There will be no updated Summary of Economic Projections accompanying the meeting, leaving investors to sift through the policy statement and Chair Powell’s post-meeting press conference for any potential clues on the path of future policy.

One of the big questions going into next week is if this could be the last rate hike of the cycle. As of this morning, Friday, January 27, the fed funds futures market is pricing in an 82% implied probability for an additional 25 bps rate hike in March. While LPL Research also expects another 25 bps increase in March, there is evidence in the Treasury market that suggests the end of the cycle may be closer than we think.

The chart below shows benchmark 2-year Treasury yields compared to the upper bound of the Fed’s target range. As you will notice, 2-year yields are highly correlated to the path of monetary policy, given their short duration. In the bottom panel, the spread between the 2-year Treasury yield and the upper bound of the Fed’s target range is shown. The arrows in both panels represent crossover points when the 2-year Treasury yield crossed below the upper bound during a rate hike cycle. The shaded red panel represents U.S. recession periods.

View enlarged chart

Since early November, yields have dropped around 50 bps to 4.19% as of January 26. Lower yields have been a product of receding pricing pressures and reduced expectations for Fed tightening. While yields violated an uptrend amid their current pullback, they also dropped below the upper bound of the Fed’s target range. This crossover occurred despite Fed commentary suggesting ‘there is more work to do’ in order to bring down inflation. However, the market appears to be pricing in an end to the rate cycle perhaps sooner than the Fed suggests. Of the last five rate hike cycles shown, crossovers below the upper bound typically occurred at or near the end of a rate hike cycle (although there was an early signal in 1988).

What do these crossovers mean for markets? We analyzed forward price action after each crossover going back to the late 1970s. The table below breaks down the forward net changes in the upper bound of the Fed’s target range, the 2-year Treasury yield, and the percentage changes of the S&P 500 following each crossover during this timeframe.

View enlarged chart

A few key takeaways:

  • The upper bound of the Fed’s target range generally remains flat to lower over the proceeding 12-month period. This trend has been especially consistent over the last five major rate hike cycles going back to 1989, as each crossover signaled a pause and/or start to rate cuts.
  • There was an early signal in 1988 and also mixed results in the late 1970s and the early 1980s.
  • On average, 2-year Treasury yields traded lower across each period with few positive net changes recorded during the three-, six-, and 12-month timeframes.
  • The S&P 500 historically struggled after the first month following a crossover. However, returns materially progressed as the index posted 12-month respective average and median gains of 15.37% and 22.43%. The index also finished higher 80% of the time during this period.

In summary, the recent crossover of the 2-year Treasury yield below the upper bound of the Fed’s target range suggests the rate hike cycle could be near completion. This does not imply the Fed will immediately start cutting rates, but does perhaps alleviate some fear over a further prolonged rate hike cycle. Historically, crossovers have also been a good sign for equity markets based on above-average returns following each signal for the S&P 500.

IMPORTANT DISCLOSURES

This material is for general information only and is not intended to provide specific advice or recommendations for any individual. There is no assurance that the views or strategies discussed are suitable for all investors. To determine which investment(s) may be appropriate for you, please consult your financial professional prior to investing.

Investing involves risks including possible loss of principal. No investment strategy or risk management technique can guarantee return or eliminate risk in all market environments. For more information on the risks associated with the strategies and product types discussed please visit https://lplresearch.com/Risks  

References to markets, asset classes, and sectors are generally regarding the corresponding market index. Indexes are unmanaged statistical composites and cannot be invested into directly. Index performance is not indicative of the performance of any investment and do not reflect fees, expenses, or sales charges. All performance referenced is historical and is no guarantee of future results.

Unless otherwise stated LPL Financial and the third party persons and firms mentioned are not affiliates of each other and make no representation with respect to each other. Any company names noted herein are for educational purposes only and not an indication of trading intent or a solicitation of their products or services.

All information is believed to be from reliable sources; however, LPL Financial makes no representation as to its completeness or accuracy.

Securities and advisory services offered through LPL Financial, a registered investment advisor and broker-dealer. Member FINRA/SIPC.