
LPL Research explores record highs for the S&P 500, market drawdowns, and why this year shares some similarities with 1995.
Wealth Management
Good News: Labor Costs Are Falling
LPL Research examines the improving dynamics between labor costs and services inflation.
Strategic Asset Allocation: A 3-to-5-Year Perspective of Markets
LPL Research discusses its updated Strategic Asset Allocation and Capital Market Assumptions.
New Year Strategies for Managing Your Wealth
You work hard for your wealth, and it’s important to make sure your wealth is also working.
Is the Equal Weight S&P 500 About to Get Even?
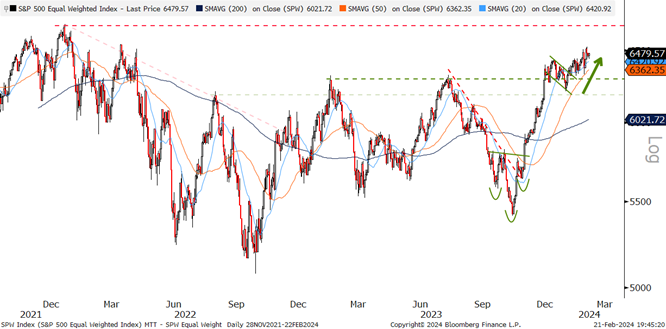
The recent technical progress on the Equal Weight S&P 500 (SPW) has been overshadowed, as only four stocks, including NVIDIA (NVDA), have accounted for more than half of the S&P 500’s total return this year, with NVIDIA alone contributing about one-quarter. As the name implies, each stock on the SPW is equally weighted, as opposed to the market-cap-weighted S&P 500 Index (SPX). The equal weighting eliminates the distortion of the mega cap components and significantly changes several sector weightings, including technology, which drops from around 30% on the SPX to only 13% on the SPW. The industrials sector has the largest increase in weighting, jumping from 9% on the SPX to nearly 16% on the SPW.
The chart below highlights the improving technical setup for the SPW. After a brief consolidation phase following a sizable rally into year end, the index has climbed above resistance from the 2023 highs. The recent breakout from the bullish flag pattern, coupled with positive momentum, suggests a retest of the January 2022 record high of 6,665 is likely.
Disclosures: All indexes are unmanaged and cannot be invested in directly. Past performance is no guarantee of future results.
It’s All Relative
While the SPW is making technical progress in absolute terms, its relative strength compared to the broader market has been underwhelming. The chart below compares both indexes in a ratio chart, used to identify relative trend direction and strength. When the ratio chart is rising, the SPW is outperforming the SPX, and vice versa when it is declining.
Currently, the ratio chart remains in a downtrend but is near a key support level dating to the pandemic-era lows. Furthermore, and as highlighted in the bottom panel, the 52-week rate of change (ROC) for the pair recently dropped to -13%, a historically low level only exceeded in April 1999. Given the stretched rate of change to the downside and the fact that the SPW vs. SPX ratio chart is at a key support level, LPL Research suspects this could be a logical spot for at least a rebound in SPW relative strength
Summary
A rebound in relative strength for the SPW does not automatically mean the SPX will trade lower, although it would likely come at the expense of mega cap leadership, which may be due for a breather from the heavy lifting these stocks have done for the market over the last year. In addition, technical progress and improving relative strength for the SPW suggest the average S&P 500 stock is doing quite well and that the market is broadening beyond the closely followed mega-caps.
As Goes January, So Goes the Year
After a relatively slow start, the S&P 500 rallied during the back half of January and closed out.
New Year Strategies for Managing Your Wealth
You work hard for your wealth, and it’s important to make sure your wealth is also working.
Is the Equal Weight S&P 500 About to Get Even?
The recent technical progress on the Equal Weight S&P 500 (SPW) has been overshadowed.
As Goes January, So Goes the Year
After a relatively slow start, the S&P 500 rallied during the back half of January and closed out.
New Year Strategies for Managing Your Wealth
You work hard for your wealth, and it’s important to make sure your wealth is also working.